05/10/2019
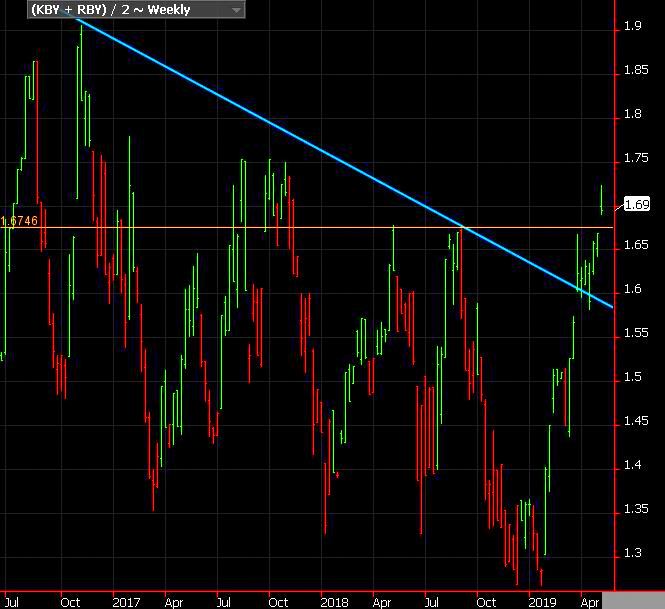
Spot cheese prices finished the week at $1.69 block/barrel average, finally breaking through the resistance level we’ve been highlighting the last few weeks, and a level not seen since November 2017.
Spot Market Recap
| Spot Product | 5/3 | 5/10 | Change |
| Cheddar Blocks | $1.6750 | $1.6800 | $0.0050 |
| Cheddar Barrels | $1.6625 | $1.7100 | $0.0475 |
| Butter | $2.2700 | $2.3400 | $0.0700 |
| Grade A NDM | $1.0525 | $1.0675 | $0.0150 |
| Dry Whey | $0.3475 | $0.3475 | $0.0000 |
Spot Market Trade Volume
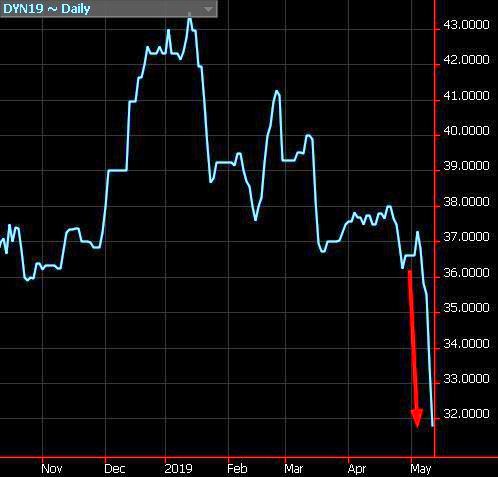
With spot cheese prices hitting a multi-year high, one might have expected Class III and cheese futures to finished the week higher, but that was decidedly not the case. Last week’s Dairy Product Report highlighted the fact that dry whey inventories were growing, despite a big drop in output, due to demand destruction from the African Swine Virus. While spot dry whey finished the week unchanged with no trades, dry whey futures tumbled, with many making new contract lows.
With each penny lower shaving 6 cents off the Class III calculation, the drop in several futures contracts took 30-36 cents off of potential Class III settlements. As a result, Class III futures finished in the red, with double-digit losses June through March.
Futures Recap
| Futures Month | Class III 05/03 | Class III 05/10 | Change | Cheese 05/03 | Cheese 05/10 | Change | Dry Whey 05/03 | Dry Whey 05/10 | Change |
| May-19 | $16.37 | $16.33 | ($0.04) | $1.690 | $1.699 | $0.009 | 38.900¢ | 36.750¢ | (2.150¢) |
| Jun-19 | $16.58 | $16.31 | ($0.27) | $1.716 | $1.710 | ($0.006) | 37.600¢ | 34.050¢ | (3.550¢) |
| Jul-19 | $16.77 | $16.38 | ($0.39) | $1.739 | $1.729 | ($0.010) | 37.300¢ | 31.800¢ | (5.500¢) |
| Aug-19 | $17.08 | $16.63 | ($0.45) | $1.769 | $1.757 | ($0.012) | 37.000¢ | 31.500¢ | (5.500¢) |
| Sep-19 | $17.21 | $16.82 | ($0.39) | $1.780 | $1.776 | ($0.004) | 37.250¢ | 31.500¢ | (5.750¢) |
| Oct-19 | $17.16 | $16.79 | ($0.37) | $1.778 | $1.771 | ($0.007) | 36.775¢ | 31.200¢ | (5.575¢) |
| Nov-19 | $17.00 | $16.60 | ($0.40) | $1.765 | $1.754 | ($0.011) | 37.350¢ | 31.200¢ | (6.150¢) |
| Dec-19 | $16.70 | $16.34 | ($0.36) | $1.740 | $1.728 | ($0.012) | 37.100¢ | 31.350¢ | (5.750¢) |
| Jan-20 | $16.40 | $16.11 | ($0.29) | $1.710 | $1.707 | ($0.003) | 36.875¢ | 32.000¢ | (4.875¢) |
| Feb-20 | $16.26 | $16.10 | ($0.16) | $1.700 | $1.705 | $0.005 | 36.750¢ | 33.950¢ | (2.800¢) |
| Mar-20 | $16.30 | $16.09 | ($0.21) | $1.696 | $1.706 | $0.010 | 37.000¢ | 32.500¢ | (4.500¢) |
| Apr-20 | $16.31 | $16.26 | ($0.05) | $1.706 | $1.716 | $0.010 | 37.875¢ | 34.500¢ | (3.375¢) |
| 12 Mo Avg | $16.68 | $16.40 | ($0.28) | $1.732 | $1.730 | ($0.003) | 37.315¢ | 38.000¢ | 0.685¢ |
A tightening cream supply and good demand saw both butter and Class IV futures finish the week higher, but NDM gave up some ground.
| Futures Month | Butter 05/03 | Butter 05/10 | Change | Class IV 05/03 | Class IV 05/10 | Change | NDM 05/03 | NDM 05/10 | Change |
| May-19 | 228.750¢ | 227.000¢ | (1.750¢) | $16.27 | $16.15 | ($0.12) | 101.125¢ | 100.975¢ | (0.150¢) |
| Jun-19 | 232.750¢ | 234.650¢ | 1.900¢ | $16.68 | $16.80 | $0.12 | 104.800¢ | 104.775¢ | (0.025¢) |
| Jul-19 | 235.900¢ | 239.375¢ | 3.475¢ | $17.02 | $17.15 | $0.13 | 107.450¢ | 107.300¢ | (0.150¢) |
| Aug-19 | 237.625¢ | 241.050¢ | 3.425¢ | $17.25 | $17.35 | $0.10 | 109.025¢ | 108.400¢ | (0.625¢) |
| Sep-19 | 238.625¢ | 243.100¢ | 4.475¢ | $17.35 | $17.51 | $0.16 | 110.000¢ | 109.500¢ | (0.500¢) |
| Oct-19 | 236.900¢ | 241.100¢ | 4.200¢ | $17.39 | $17.43 | $0.04 | 111.400¢ | 111.000¢ | (0.400¢) |
| Nov-19 | 234.475¢ | 236.400¢ | 1.925¢ | $17.36 | $17.48 | $0.12 | 112.550¢ | 112.425¢ | (0.125¢) |
| Dec-19 | 228.900¢ | 229.650¢ | 0.750¢ | $17.20 | $17.28 | $0.08 | 113.700¢ | 113.525¢ | (0.175¢) |
| Jan-20 | 223.275¢ | 223.500¢ | 0.225¢ | $17.00 | $17.12 | $0.12 | 114.500¢ | 114.975¢ | 0.475¢ |
| Feb-20 | 222.150¢ | 222.150¢ | 0.000¢ | $17.00 | $17.10 | $0.10 | 115.100¢ | 115.675¢ | 0.575¢ |
| Mar-20 | 222.500¢ | 222.975¢ | 0.475¢ | $17.10 | $17.13 | $0.03 | 116.025¢ | 116.250¢ | 0.225¢ |
| Apr-20 | 223.025¢ | 223.550¢ | 0.525¢ | $17.18 | $17.29 | $0.11 | 116.700¢ | 117.225¢ | 0.525¢ |
| 12 Mo Avg | 230.406¢ | 232.042¢ | 1.635¢ | $17.07 | $17.15 | $0.08 | 111.031¢ | 111.002¢ | (0.029¢) |
This week’s GDT auction saw the dairy price index gain 0.4%. Prices rose for the 11th consecutive event, but the increases are getting smaller. Cheddar cheese prices declined 2.4%. Tariffs appear to be punishing exports. The USDEC reported this week that total dairy exports in March were down 12% compared to a year ago. Sales to China were cut in half, with total dry whey exports plummeting 22%. WMP exports decliend by an even stronger 33%. One bright spot; record amounts of cheese were exported during the month, with new and growing markets found in South Korea, the Middle East and Central America. Total cheese exports in March were 10% higher than a year ago.
Moving along to this week’s Dairy Market News updates. Milk production in the EU has not met expectations so far in 2019. Feed quality issues and the lingering effects of last year’s drought has many disappointed with current EU output, which typically peaks in May. Demand for EU cheese is strong, but the lower milk production is keeping cheese output less than desired. Cheese inventories are being poached to meet current demand, with May production already sold. Cheese prices are expected to increase soon.
Here in the U.S., peak production has yet to cause any issues. In the Midwest, spot loads of milk are still trading just above or below Class, significantly higher than the past couple years. Cheese demand is good throughout much of the country, with grilling season giving barrel demand a boost. Western cheese producers even report that much of current cheese output is committed and supplies are a bit snug. Concern is growing among processors what milk availability might look like later this year. Cream availability has taken a hit across all regions, limiting churning activity. Stocks are still in good supply, but some contacts expect a spike in prices this fall. The tone for NDM has gotten more bullish as well, due to a tightening market for recently produced powder.
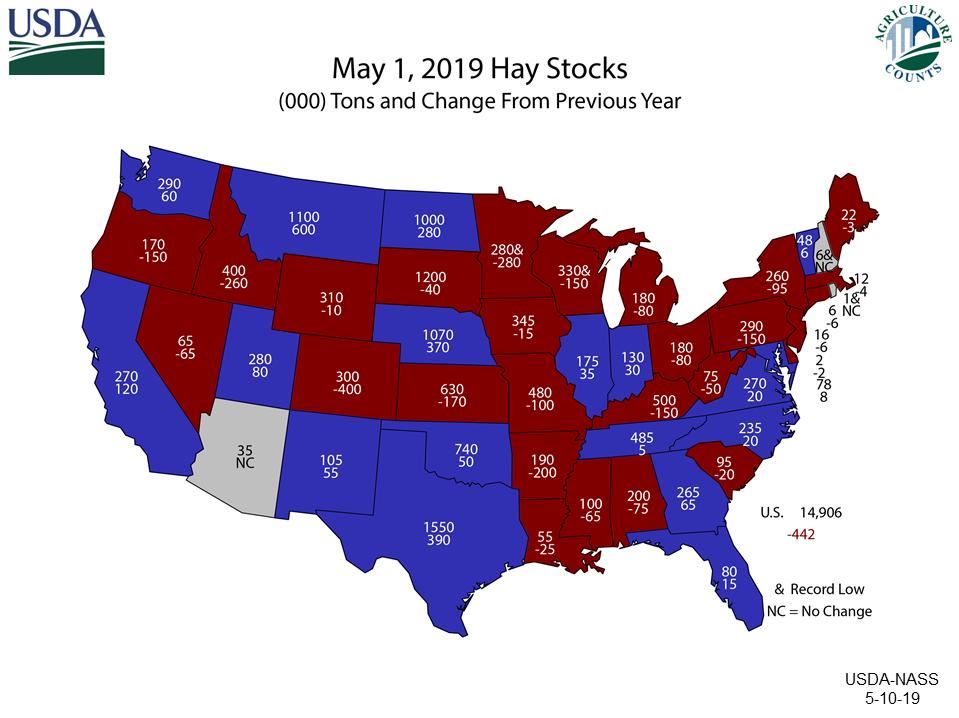
USDA reported that May 1st hay stocks are the lowest since 2013 and second lowest since 1950.