02/21/2020
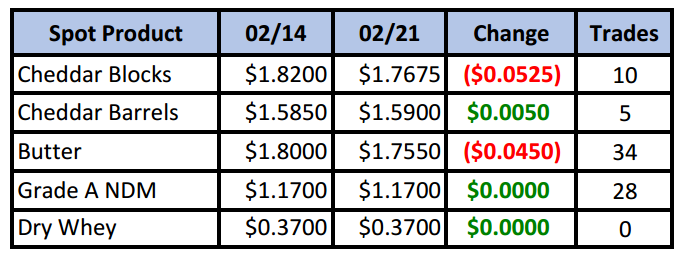
The block/barrel spread continued to shrink this week as blocks gave in under selling pressure, while barrels managed a small gain, putting it at 17¾¢ premium to blocks. Volume was heaviest in butter as it continues to look for a bottom, while NDM was able to hold steady.
Spot Market Recap
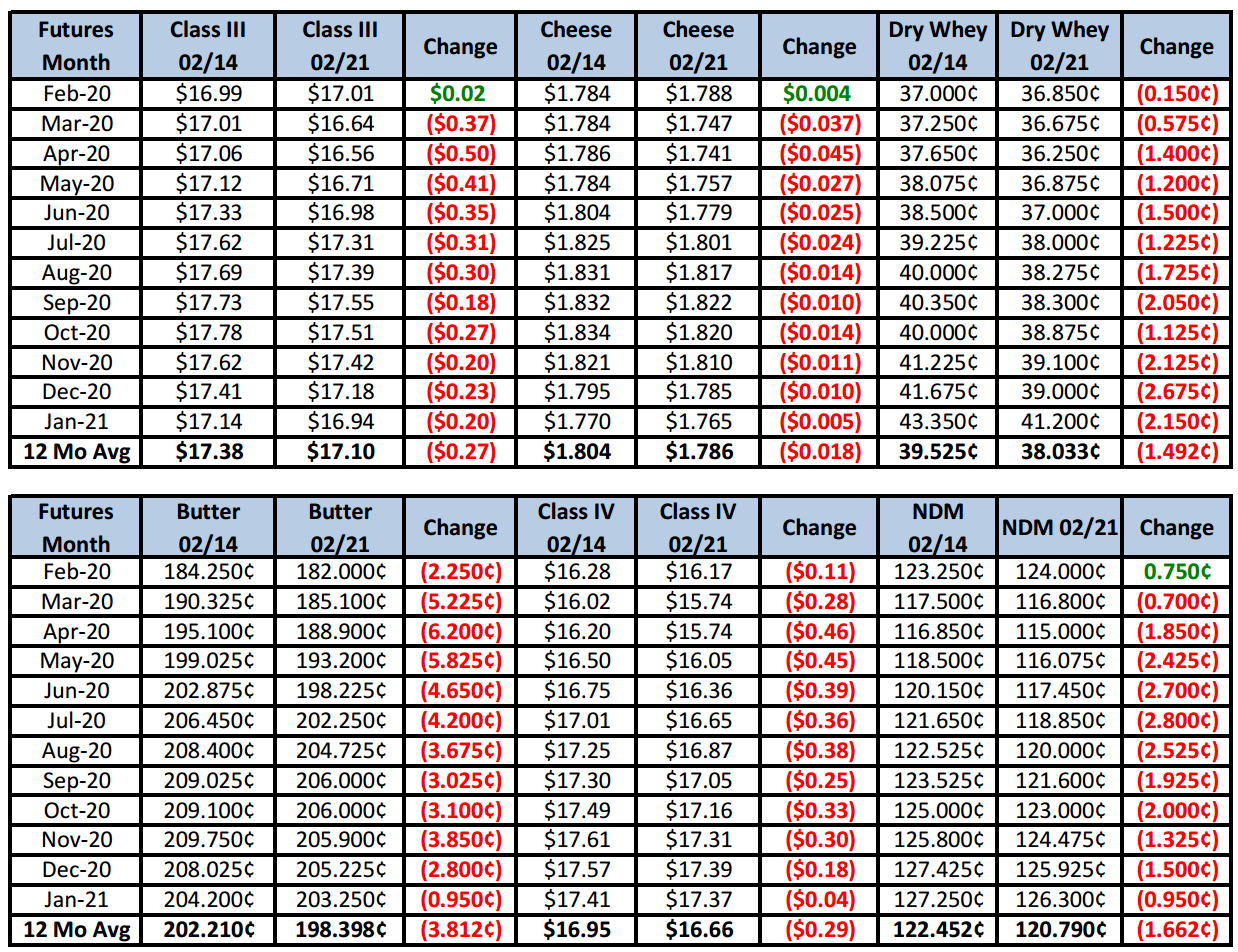
Futures Recap
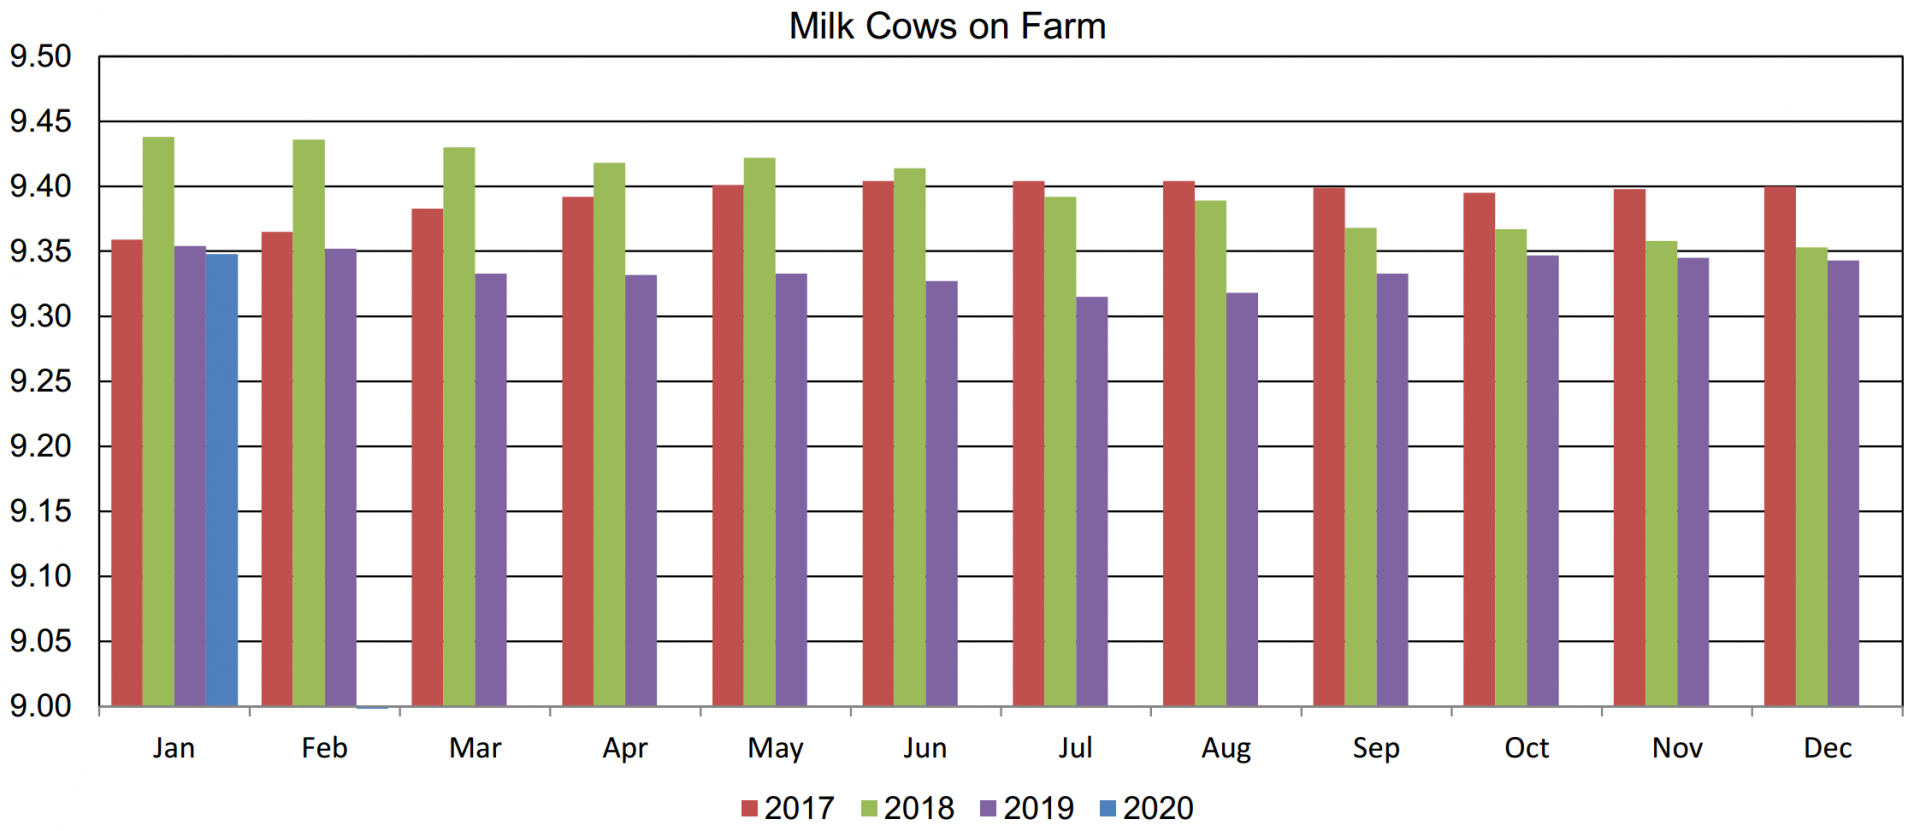
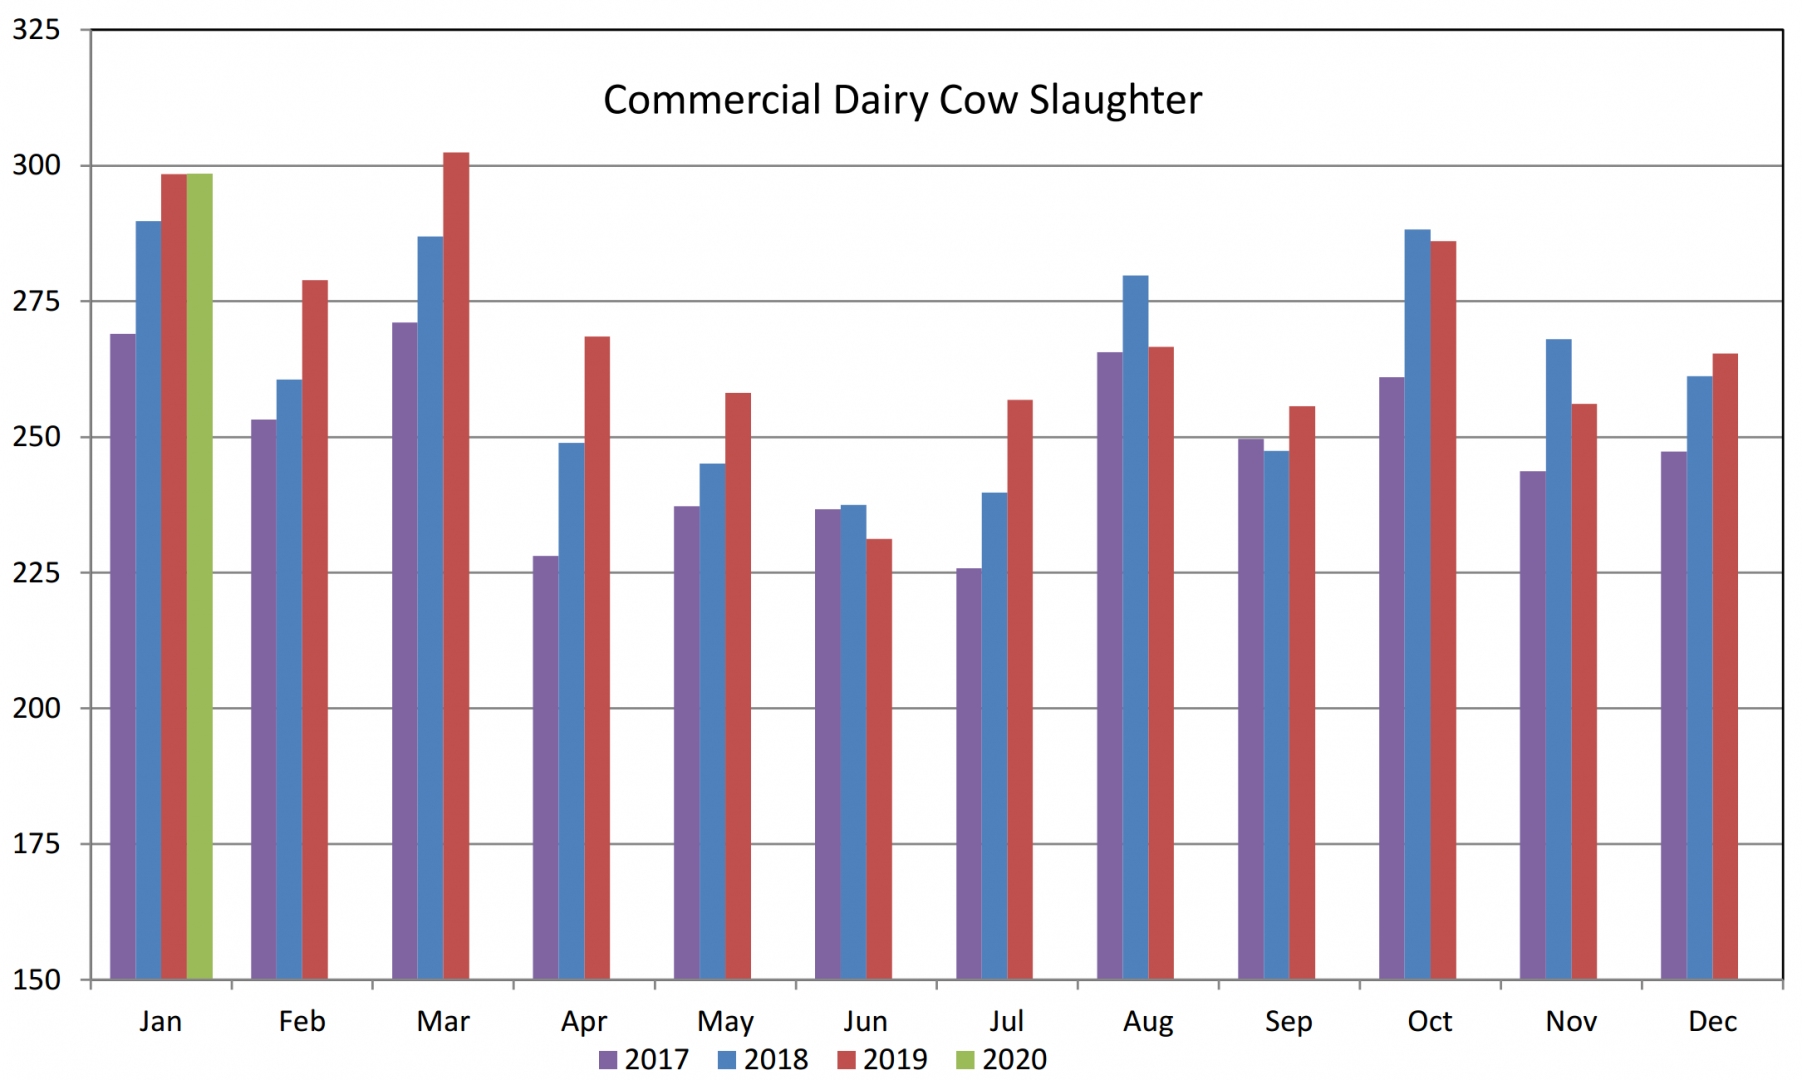
With the Milk Production Report showing mostly month over month gains in the milking herd, slaughter numbers going forward are going to need to pick up steam to keep output from growing too rapidly. Either that or new demand, domestic or global needs to develop in order to sustain current prices.
Speaking of prides, we really thought they were beginning to head back up. Recent price action indicated a bottom formation with a couple positive days following. But since then, call it the corona-effect, or whatever, major technical damage has been done. Consider the March Class III chart below:

The 16.90 level had been a point of resistance, having failed there in July, but then we broke through in strong fashion in early November, retested it in Dec and went on to make a higher high. That usually means the trend will continue with a higher low and another higher high, and the 16.90 level flips from being resistance, to support. Obviously that didn’t happen and we have crashed well below that 16.90 level now. And all the charts Feb-Jun look about the same. All we can conclude from here is that the short term trend is now lower. Support for the March contract comes in around the 16.20 level, unless we can break back above 16.90 and stay there. Hopefully many of you have taken protective measures though June and can ride this out. We are still bullish longer term, but again, it doesn’t look too positive near term.
Have a great weekend.